By Steffen Schmidt, Frank Buckler, Nadine Hennigs, Matthias Rothensee, Levke Albertsen
A sophisticated Brand Insights 4.0 approach incorporating all elements of the analytical power of the stages 1.0 and 3.0 has the capability to improve the management decisions of brand managers effectively. In this article, the authors use Brand 4.0 Insights, combining implicit and explicit measures of customer perceived value (CPV) and brand love (BL) to explain brand attraction using Universal Structure Modeling.
Necessity For An Information-Based Brand Management
The equity of a brand is widely considered and accepted as a key asset for most firms and brand managers. From a company’s perspective, a strong brand acts as a guardian of the firm’s performance. Actually, the psychological advantages of such guardianship are greater customer loyalty and less customer price sensitivity, which leads as a financial consequence to higher and lasting revenue streams. Therefore, marketers undertake vast efforts on creating and building up a strong brand by implementing various marketing activities. These efforts aiming at superior brand attraction from a customer’s point of view are quite often related with massive spending in brand communication (e.g., sport sponsorship) and extensive customer loyalty programs (e.g., tier system) in order to keep the brand permanently visible as well as rewarding at every purchase (consumption). As the competition heats up, often steadily increasing brand investments have the character of a mind-oriented armament to conquer and occupy the heads of a potential target group by a majority. The rivalry between titans of a given market often leads to a brand war. A famous brand war in the past was the fight Nintendo vs. Sega – also known as the first console war – in the early and mid-90’s, while in the present, the great smartphone war between Apple and Samsung goes ahead round by round quite prominently. And similar to a real war, it is all about information (and disinformation) to hold the upper hand. That said, in the field of marketing the “brand commander” with the more comprehensive and most accurate information has best chances to win the combat in customer’s mind due to an improved scope of action to adjust and place the brand in an ideal mental position.
Elements of a Modern Brand Evaluation in the Digital Age
For the assessment of brand-related marketing actions, science and business practice often refer to concepts that include brand awareness and brand image. Commonly, conventional methods are used like self-reporting scales to measure these key performance indicators. In addition, the captured data are generally analysed by relatively inefficient statistical methods such as correlation analysis or linear regression techniques in order to determine any relationships among the investigated brand constructs. As discussed in the next paragraphs, that Brand Insight 1.0 approach is somewhat purblind and old-fashioned.
First, more and more studies, especially in the field of neuroeconomic, suggest that most mental processes regarding brand-related perception and behavior are of so-called implicit nature, taking place hidden in the unconscious mind, and are therefore inaccessible for the introspective nature of conventional methods, e.g., focus interviews or self-reporting. In contrast to that, implicit measures like fMRI or latency-based methods such as the well-known Implicit Association Test (IAT) are capable to capture unconscious processes. Even since the turn of the millennium, certain types of implicit measures have become increasingly popular and provided an improved Brand Insights 2.0 approach. Next, being confronted with the rise of Big Data in recent years, analytic techniques using neural networks have constantly diffused in marketing research to process complex, unstructured and heterogeneous data. Moreover, advanced statistical software packages like NEUSREL have vastly enhanced the acceptance of those sophisticated methods and established Brand Insights 3.0.
Although all elements of Brand Insights 1.0 to 3.0 are available nowadays for a powerful and comparatively precise brand evaluation, surprisingly, a consequent disregard of a combined measurement approach is recognisable in both science and business practice. That said, such a combined approach refers to the assessment of explicit as well implicit processes in the same study, whereby the captured heterogeneous, complex and partially unstructured data, due to the distinct measurement nature of the specific assessment sources, is getting analysed by applying neural network methods. One possible explanation for the present lack of combined measurement approaches might be the specialisation and the fact that basically available methods concerning data assessment and analysis – classical as well as modern techniques – are typically applied apart from each other. However, a sophisticated Brand Insights 4.0 approach incorporating all elements of the analytical power of the stages 1.0 to 3.0 has obviously the capability to improve the management decisions of brand managers effectively.

Case Study: The Cola War Reanalysed General Case Study Background Information
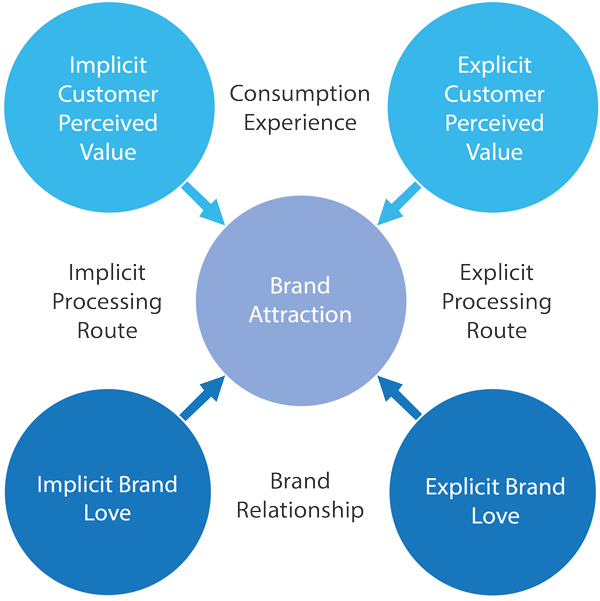
The following case study provides evidence for the superior performance of an integrated measurement approach including the use of neural network analytics. Specifically, in this study, brand attraction was considered as the key performance outcome indicating the current brand relevance (status) in a customer’s head. As shown in the conceptual model shown in Figure 1, customer perceived value (CPV) and brand love (BL) were chosen as key performance drivers in strengthening and enhancing brand attraction for a positive (future) brand-related decision making from a customer’s point of view (e.g., recommendation, repurchase).
As a practicable analytic setting for the intense brand wars in the customer’s mind seen worldwide, the ongoing battle between Coca-Cola and Pepsi-Cola was chosen. Both brands have been fighting each other for more than a century in order to claim the first position in the customer’s head, and consequently to occupy their purses. The Pepsi Challenge in 1975 was a historical marketing highlight of the eternal feud between both soda brands.
However, an already classical fMRI study by McClure et al. (2004) found evidence for the lasting market dominance of Coke. While Coca-Cola and Pepsi-Cola are highly identical concerning their chemical composition, the subjects in the behavioral taste experiment of McClure et al. (2004) dominantly preferred Coca-Cola when the brand logo was shown (brand-cued trial). However, in a blind test, when subjects were unaware about the brand they were consuming (non-brand-cued trial), the dominance disappeared and no clear preference, neither for Coca-Cola nor for Pepsi-Cola, could be attested. Without any brand-related information, brain structures responsible for sensory information were more activated and modulated the decision-making process. In contrast, when the respective brand was identified by the subjects, results indicated more activation in brain regions responsible for memory and cultural information. That “Pepsi Paradox”, a stronger preference for labeled Coca-Cola than for labeled Pepsi-Cola, is driven by the availability of brand information (e.g., brand logo). When Coca-Cola is recognised, strong brain responses from the memory evokes some type of mental immunization against functional product preferences (e.g., taste). In detail, the higher commercial efforts of Coca-Cola – using effective cultural images like TV spots, print advertising, personalized bottles etc. – elicit successful brand information processing in order to create salient brand associations, stored in and retrieved from long-term memory, which are capable to override the taste alone. On an unconscious level, those types of associations can be assessed by implicit association measures from psychology (e.g., IAT) comparatively accurately and inexpensive.
Measures
With regard to the salient association assessment, both key performance drivers were measured using explicit and implicit measures. Specifically, a self-report was applied to determine an explicit and more reflected brand association evaluation. In contrast, a simple reaction time measurement was used to capture an implicit and more automatic brand association assessment. In addition, brand attraction as the key performance outcome was captured on eleven-point semantic differentials (overall pleasantness, word-of-mouth communication and buying intention).
In order to analyse the data, universal structure modeling (USM) was applied using the software statistic package NEUSREL. USM relies on an iterative PLS approach for testing structural equation models (SEM), but uses a Bayesian neural network instead of linear least squares regression. That analytical method combination allows to quantify and visualise nonlinear and interactive effects among model constructs and represents a more exploratory approach to test hidden model structures, whereas conventional SEM is limited to model estimation with a priori hypothesised paths, not capable to identify theoretically unrelated (not proposed) paths, nonlinearity, and interaction effects.
Sample and Procedure
In February 2015, 87 German respondents answered the whole survey. Each participant completed the measurement procedure related to the given two selected soda brands Coca-Cola and Pepsi-Cola. For the sake of clarity and comparability, all explicit and implicit association scores as well as the brand attraction score were rescaled from 0 to 100, with greater higher (lower) scores indicating a stronger positive (negative) association assessment and behavioral evaluation, respectively.
Results
All implicit and explicit measures reveal satisfactory values in terms of reliability and validity. In particular, the respective implicit and explicit measures are highly unrelated indicated by the low correlation coefficients confirming discriminant validity (BL: 0.219; CPV: 0.507). Indeed, the corresponding implicit and explicit measures incorporated the same items, but shared no common variance with each other. This analysis implies the consideration of the implicit and explicit assessment as related but distinct measures namely for CPV and BL.
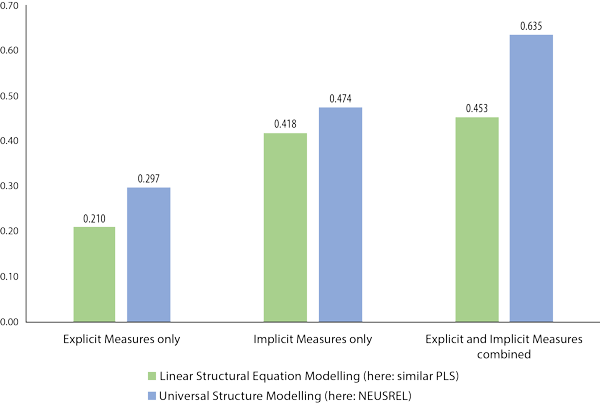
Moreover, Figure 2 compares the coefficient of determination (R-squared value) between the different measure and analytic approaches. First, the statistical consideration of implicit measures only revealed a higher degree of explanation concerning brand attraction in comparison to explicit measures only, whereby USM performs slightly better in relation to linear SEM. However, expectedly best predictive performance with highest R-squared values at a substantial level above .6 is revealed by the combined measurement incorporating both an implicit and explicit assessment and the appliance of USM. In fact, the R-squared value of that innovative Brand Insights 4.0 research approach is about three times higher compared to the conventional Brand Insights 1.0 research approach still often used in contemporary marketing research everyday work.

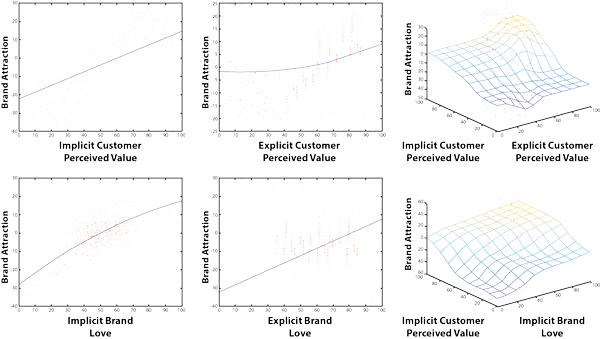
The superiority of the introduced Brand Insight 4.0 attempt is based on the detection of nonlinearity and interaction effects, which are disregarded in the data by regular analytic approaches, but clearly identified by USM as shown in Figure 3. In the current study, the significant impact of implicit CPV and explicit BL on brand attraction is linear, while a nonlinear significant effect of explicit CPV as well as of implicit BL on brand attraction can be found. In addition, an interaction effect among implicit and explicit CPV as well as among implicit BL and implicit CPV on brand attraction exists. With regard to the average simulated effect (ASE) and overall explained absolute deviation (OEAD), highest effect strength is revealed by implicit BL (ASE = 0.425, OEAD = 0.210) and implicit CPV (ASE = 0.320, OEAD = 0.238). The effect strength for both explicit measures is well below that implicit impact level, whereby the results suggest a higher effect of explicit BL (ASE = 0.208, OEAD = 0.187) compared to explicit CPV (ASE = 0.108, OEAD = 0.098).

Finally, the brand performance of Coca-Cola and Pepsi-Cola among their customers (Coke: n = 69, Pepsi: n = 32) was investigated. Statistically, on the key performance driver level Coke performs better regarding the explicit facets of CPV and BL. A statistical group comparison confirms this pattern. Here, Coke differs significantly and positively compared to Pepsi concerning explicit CPV (∆M = 5.85, Z = -1.720, p = 0.085) and explicit BL (∆M = 7.71, Z = -2.349, p = 0.019). However, Pepsi reveals the same performance as Coke on an implicit information processing level regarding implicit CPV (∆M = 0.50, Z = -0.111, p = 0.912) and implicit BL (∆M = 1.06, Z = -0.820, p = 0.412). Against the background of this performance driver assessment and the effect strength evaluation as shown in the paragraph above, also, it is not surprising that Coke reveals a well higher level of brand attraction (∆M = 10.85, Z = -2.419, p = 0.016). These results are supportive of previous studies like the one of McClure et al. (2004). Both soda brands are similar strong on a specific unconscious level, here regarding the implicit facts of CPV and BL. However, Coke’s better brand attraction is basically based on a higher awareness and consciousness with regard to the personal relevance of the brand consumption in the customer’s everyday life.
These findings of the Brand Insights 4.0 approach suggest that Coke’s advertising spending are efficient to claim first position in most customers’ heads, thus Coke should hold their brand communication activities (as long as the competition pressure is unchanging). However, the lead might be illusive to a certain degree, since Coke’s dominance is primarily grounded on a better awareness on a conscious brand information processing level. In detail, that result might be indicative of the fact that the cultural images of Coke are more on the spot due to a greater advertising impact (e.g., more frequent communicative touchpoint contacts like TV spots). On the other hand, Pepsi evokes the identical brand-related competitiveness as Coke on an implicit level, meaning Pepsi unconsciously provides the same product value (here: CPV) and identity-establishing relationship valence (here: BL). Yet, Pepsi’s customers are not aware of this. To change that based on the findings of the presented Brand Insights 4.0, Pepsi should enhance the frequency of contacts between brand and customers – basically by brand communication to foster the salient association network – for an improved brand positioning in the future.
Conclusion, Findings and Implications
Altogether, the findings indicate the importance (and opportunity) of determining implicit and explicit brand-related associations for a better brand understanding in general and to manage brand performance more precisely in particular. Additionally, the presented case study stresses the advantage of sophisticated analytical approaches based on neural network methods.
In detail, the presented and discussed results of the case study demonstrate the superiority of the introduced Brand Insights 4.0 research approach. First, even well-established constructs in the field of marketing and marketing research like customer perceived value can be assessed by innovative implicit measures. Second, the additional application of implicit measures reveals other facets of the same construct. Literally spoken, conventional and explicit measures like verbal self-report are exposing only the tip of the iceberg, but it takes implicit measures like reaction time measurement to uncover the whole brand knowledge structure (memories, wanting, etc.) below the surface of introspection. Third, modern analytic approaches like USM are capable to identify hidden structures in the data, which are easily overlooked by conventional analytic approaches like linear SEM.
That said, the precision, and therefore the added value of the introduced Brand Insights 4.0 approach – the combination of implicit and explicit measures and effective big data techniques (e.g., USM)– is about three times better and higher, respectively, in relation to a conventional Brand Insights 1.0 approach relying on explicit measures only and limited statistical techniques (e.g., linear SEM). Consequently, marketers have all the separate elements of a sophisticated measurement and analytic basis for the management of their brand available – they just have to tie the knot and combine them to a holistic Brand Insights 4.0 approach. Once more, it can be stated that the whole always exceeds the sum of its parts – a combined approach is far more effective than the isolated use of its constituent elements.
Steffen Schmidt is an expert in the field of neuroeconomics and brand management. Currently, he works as an Assistant Professor at the Institute of Marketing and Management, Leibniz University of Hannover and counsels companies on brand research issues.
Frank Buckler is a marketing, sales and analytic specialist. His scientific and business background creates his distinguishing expertise in uncovering management success drivers. He is the CEO at Success Drivers (incl. NEUSREL Causal Analytics), a leading consulting agency for evidence-based management.
Nadine Hennigs is an expert in the field of brand luxury management and marketing research. Presently, she works as an Assistant Professor at the Institute of Marketing and Management, Leibniz University of Hannover. Several academic articles and awards highlight her scientific expertise.
Matthias Rothensee is Research Director and Partner at eye square, a leading global provider of user & brand research. Specifically, he is an analytic specialist for advertising impact research, multivariate statistics and eye tracking. His consulting expertise is frequently demonstrated on conferences and regularly published in magazines.
Levke Albertsen is a PhD Candidate at the Institute of Marketing and Management, Leibniz University of Hannover. In her current position as a Research Assistant, she develops innovative research methods based on neuroeconomic insights.
[/ms-protect-content]


![“Does Everyone Hear Me OK?”: How to Lead Virtual Teams Effectively iStock-1438575049 (1) [Converted]](https://www.europeanbusinessreview.com/wp-content/uploads/2024/11/iStock-1438575049-1-Converted-100x70.jpg)


